GBA Tutorial
Debugging with GDB
Launch configuration
Create a new file called “launch.json” in the .vscode directory. VSCode should recognise this file and display an Add Configuration button.
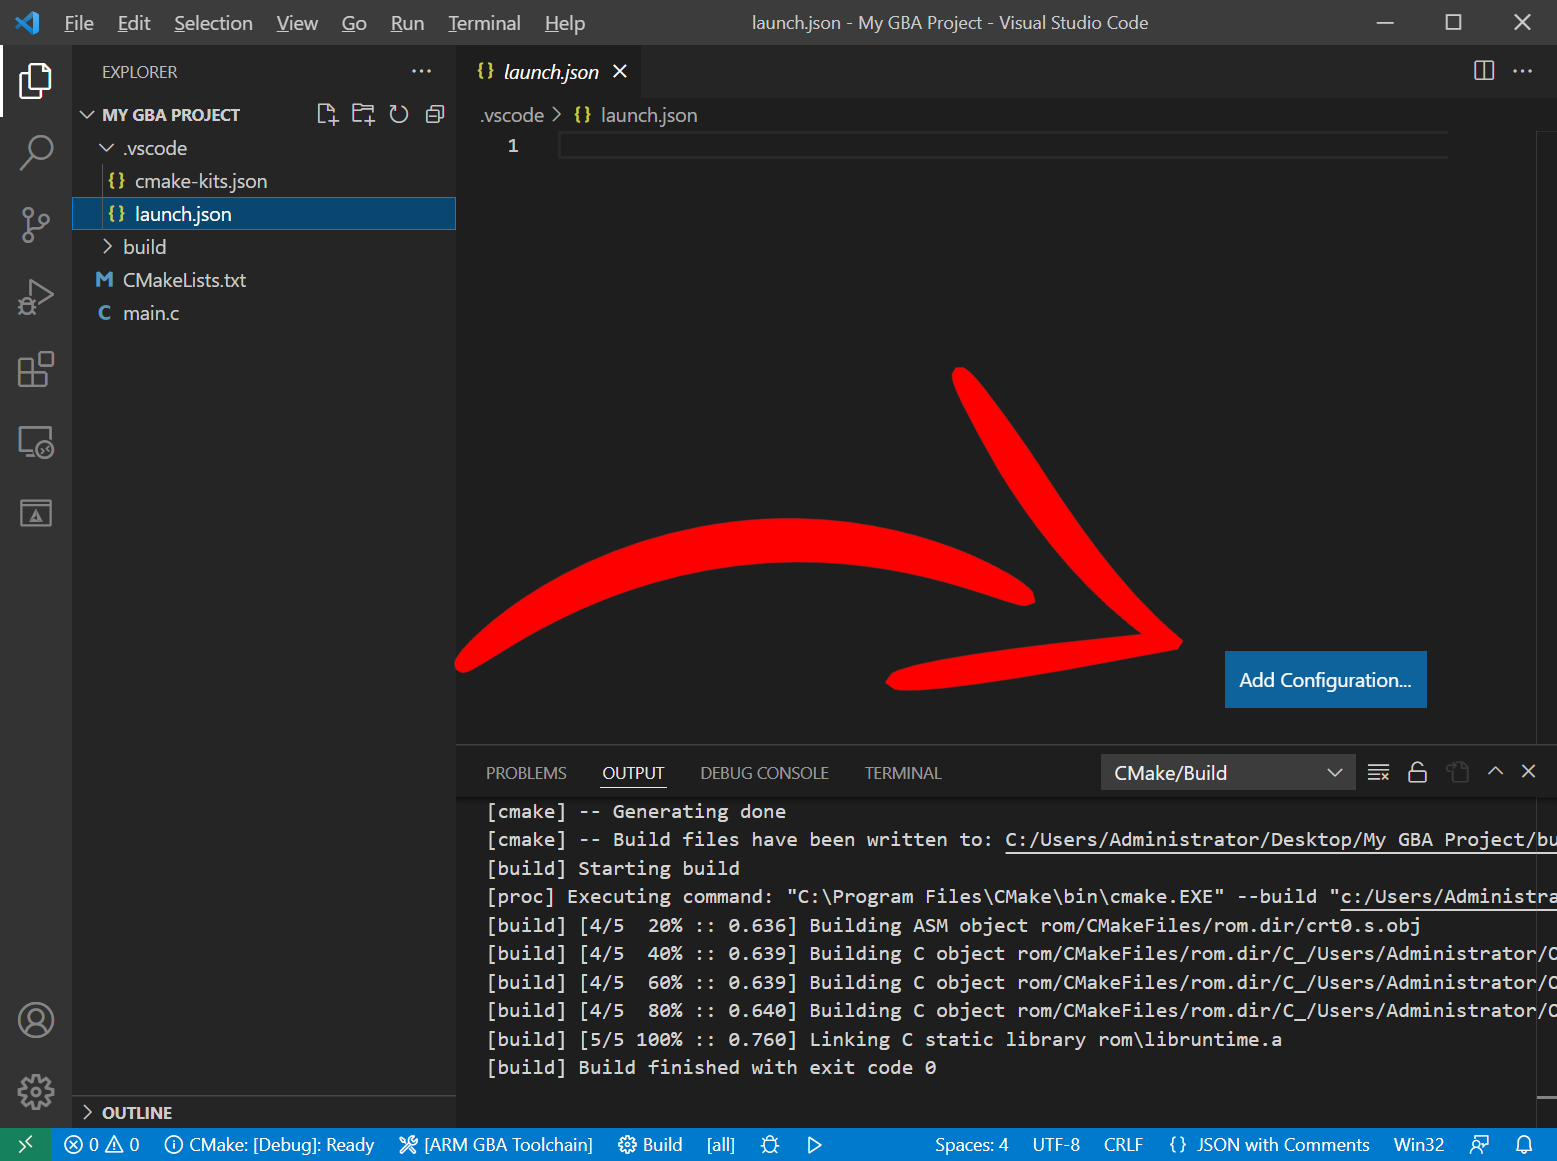
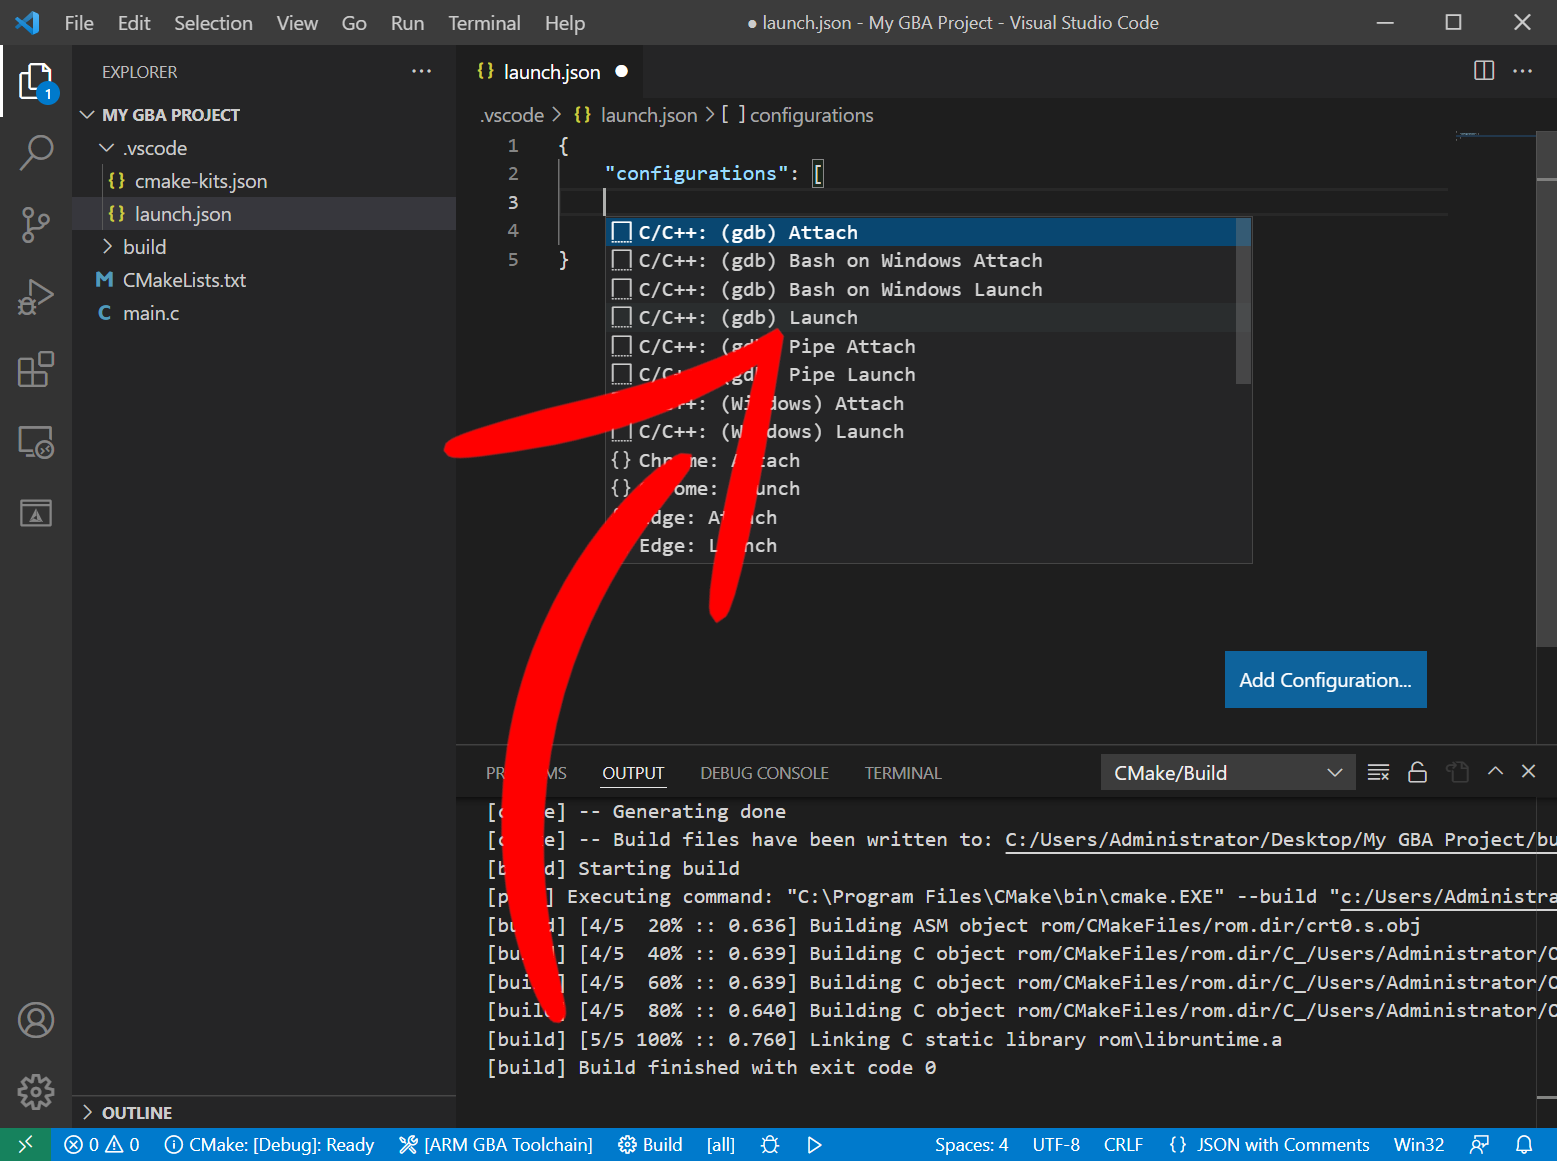
Choose the C/C++: (gdb) Launch option to generate the JSON for us to fill in.
We should now have something like the below:
{
    "configurations": [
        {
            "name": "(gdb) Launch",
            "type": "cppdbg",
            "request": "launch",
            "program": "enter program name, for example ${workspaceFolder}/a.exe",
            "args": [],
            "stopAtEntry": false,
            "cwd": "${fileDirname}",
            "environment": [],
            "externalConsole": false,
            "MIMode": "gdb",
            "miDebuggerPath": "/path/to/gdb",
            "setupCommands": [
                {
                    "description": "Enable pretty-printing for gdb",
                    "text": "-enable-pretty-printing",
                    "ignoreFailures": true
                },
                {
                    "description":  "Set Disassembly Flavor to Intel",
                    "text": "-gdb-set disassembly-flavor intel",
                    "ignoreFailures": true
                }
            ]
        }

    ]
}
Launch.json Target Architecture
By default, VSCode assumes you are going to be debugging the architecture that you’re developing from.
Add the field “targetArchitecture” with the value “arm” below the “request” field to inform gdb that we are debugging ARM:
    "request": "launch",
    "targetArchitecture": "arm",
Launch.json Program
First, change the program field to point to our GBA ELF file.
VSCode CMake tools comes with a few commands that makes writing these files a bit easier.
We can use “${command:cmake.buildDirectory}” to get the build directory of our current CMake configuration. Inside this directory is where our ELF file is built.
My ELF file is called “gba-game.elf”, so my “program” field should be:
"program": "${command:cmake.buildDirectory}/gba-game.elf",
Current working directory
This is the working directory of the gdb server (more on this in a bit). Set this to just the build directory (you’ll see why soon):
"cwd": "${command:cmake.buildDirectory}",
Debugging server address
We’ll be using mGBA’s fantastic built-in gdb-server for debugging. By default, this listens on port 2345. Because we’ll be running mGBA locally, we’ll address it with localhost.
Add a field after “MIMode” called “miDebuggerServerAddress” and set its value to “localhost:2345”:
    "MIMode": "gdb",
    "miDebuggerServerAddress": "localhost:2345",
MIMode is the type of debugger we’ll be using. mGBA has a gdb-server, so we’ll be using gdb.
mGBA debugging server
Where our debugger is and how we connect to it will depend on our platform. The “miDebuggerPath” and the “setupCommands” will vary, so delete these fields completely:
"miDebuggerPath": "/path/to/gdb",
"setupCommands": [
    {
        "description": "Enable pretty-printing for gdb",
        "text": "-enable-pretty-printing",
        "ignoreFailures": true
    },
    {
        "description":  "Set Disassembly Flavor to Intel",
        "text": "-gdb-set disassembly-flavor intel",
        "ignoreFailures": true
    }
]
And let’s replace these with entries for Windows, Linux, and macOS:
"windows": {
    "miDebuggerPath": "",
    "setupCommands": []
},
"linux": {
    "miDebuggerPath": "",
    "setupCommands": []
},
"osx": {
    "miDebuggerPath": "",
    "setupCommands": []
}
Debugger path
gba-toolchain by default will download and install the ARM GNU toolchain to a convenient shared directory. That is where our ARM gdb client is, so we need set the “miDebuggerPath” fields to the “arm-none-eabi-gdb” path depending on our operating system.
| OS | Where | VSCode variable |
|---|---|---|
| Windows | %LOCALAPPDATA% | ${env:LOCALAPPDATA} |
| Linux | Home | ${env:HOME} |
| macOS | Local user share | /usr/local/share/ |
So fill in the “miDebuggerPath” fields with the paths:
"windows": {
    "miDebuggerPath": "${env:LOCALAPPDATA}/arm-gnu-toolchain/bin/arm-none-eabi-gdb.exe",
    "setupCommands": []
},
"linux": {
    "miDebuggerPath": "~/arm-gnu-toolchain/bin/arm-none-eabi-gdb",
    "setupCommands": []
},
"osx": {
    "miDebuggerPath": "/usr/local/share/arm-gnu-toolchain/bin/arm-none-eabi-gdb",
    "setupCommands": []
}
If you configured gba-toolchain to instead use an ARM GNU toolchain in another directory then you will need to adjust these fields.
mGBA setup commands
We’ll add into “setupCommands” the command to launch mGBA’s gdb-server and our GBA program.
Due to a quirk in how mGBA runs and how VSCode waits for gdb-servers to connect, we have to launch mGBA as its own process so there’s no deadlock between it and VSCode.
On Windows this can be done with the start /b "" command. On Linux and macOS you need only to end your shell command with the ampersand symbol &, however on macOS we can open the mGBA app in its own process with the open -a command.
mGBA uses the -g option to start its gdb-server, so we need to include that.
Here’s my setup commands that I use on Windows, Linux, and macOS:
Windows
On my Windows machine, mGBA.exe is located at “C:/Program Files/mGBA/mGBA.exe”.
"windows": {
    "miDebuggerPath": "${env:LOCALAPPDATA}/arm-gnu-toolchain/bin/arm-none-eabi-gdb.exe",
    "setupCommands": [
        {
            "text": "shell start /b \"\" \"C:/Program Files/mGBA/mGBA.exe\" -g \"${command:cmake.buildDirectory}/gba-game.elf\""
        }
    ]
},
Linux
On my Linux machine, mgba-qt is located at “/usr/local/bin/mgba-qt”.
"linux": {
    "miDebuggerPath": "~/arm-gnu-toolchain/bin/arm-none-eabi-gdb",
    "setupCommands": [
        {
            "text": "shell \"/usr/local/bin/mgba-qt\" -g \"${command:cmake.buildDirectory}/gba-game.elf\" &"
        }
    ]
},
macOS
On my macOS machine, mGBA is located at “/Applications/mGBA.app”, which can be opened with the open -a mGBA command.
"osx": {
    "miDebuggerPath": "/usr/local/share/arm-gnu-toolchain/bin/arm-none-eabi-gdb",
    "setupCommands": [
        {
            "text": "shell open -a mGBA --args -g \"${command:cmake.buildDirectory}/gba-game.elf\""
        }
    ]
}
The final launch.json
This is what my launch.json looks like after setting it up:
{
    "configurations": [
        {
            "name": "(gdb) Launch",
            "type": "cppdbg",
            "request": "launch",
            "targetArchitecture": "arm",
            "program": "${command:cmake.buildDirectory}/gba-game.elf",
            "args": [],
            "stopAtEntry": false,
            "cwd": "${command:cmake.buildDirectory}",
            "environment": [],
            "externalConsole": false,
            "MIMode": "gdb",
            "miDebuggerServerAddress": "localhost:2345",
            "windows": {
                "miDebuggerPath": "${env:LOCALAPPDATA}/arm-gnu-toolchain/bin/arm-none-eabi-gdb.exe",
                "setupCommands": [
                    {
                        "text": "shell start /b \"\" \"C:/Program Files/mGBA/mGBA.exe\" -g \"${command:cmake.buildDirectory}/gba-game.elf\""
                    }
                ]
            },
            "linux": {
                "miDebuggerPath": "~/arm-gnu-toolchain/bin/arm-none-eabi-gdb",
                "setupCommands": [
                    {
                        "text": "shell \"/usr/local/bin/mgba-qt\" -g \"${command:cmake.buildDirectory}/gba-game.elf\" &"
                    }
                ]
            },
            "osx": {
                "miDebuggerPath": "/usr/local/share/arm-gnu-toolchain/bin/arm-none-eabi-gdb",
                "setupCommands": [
                    {
                        "text": "shell open -a mGBA --args -g \"${command:cmake.buildDirectory}/gba-game.elf\""
                    }
                ]
            }
        }

    ]
}
Of course, if you don’t need to worry about particular operating systems you can remove their entries entirely, but I have all 3 here just for your reference.
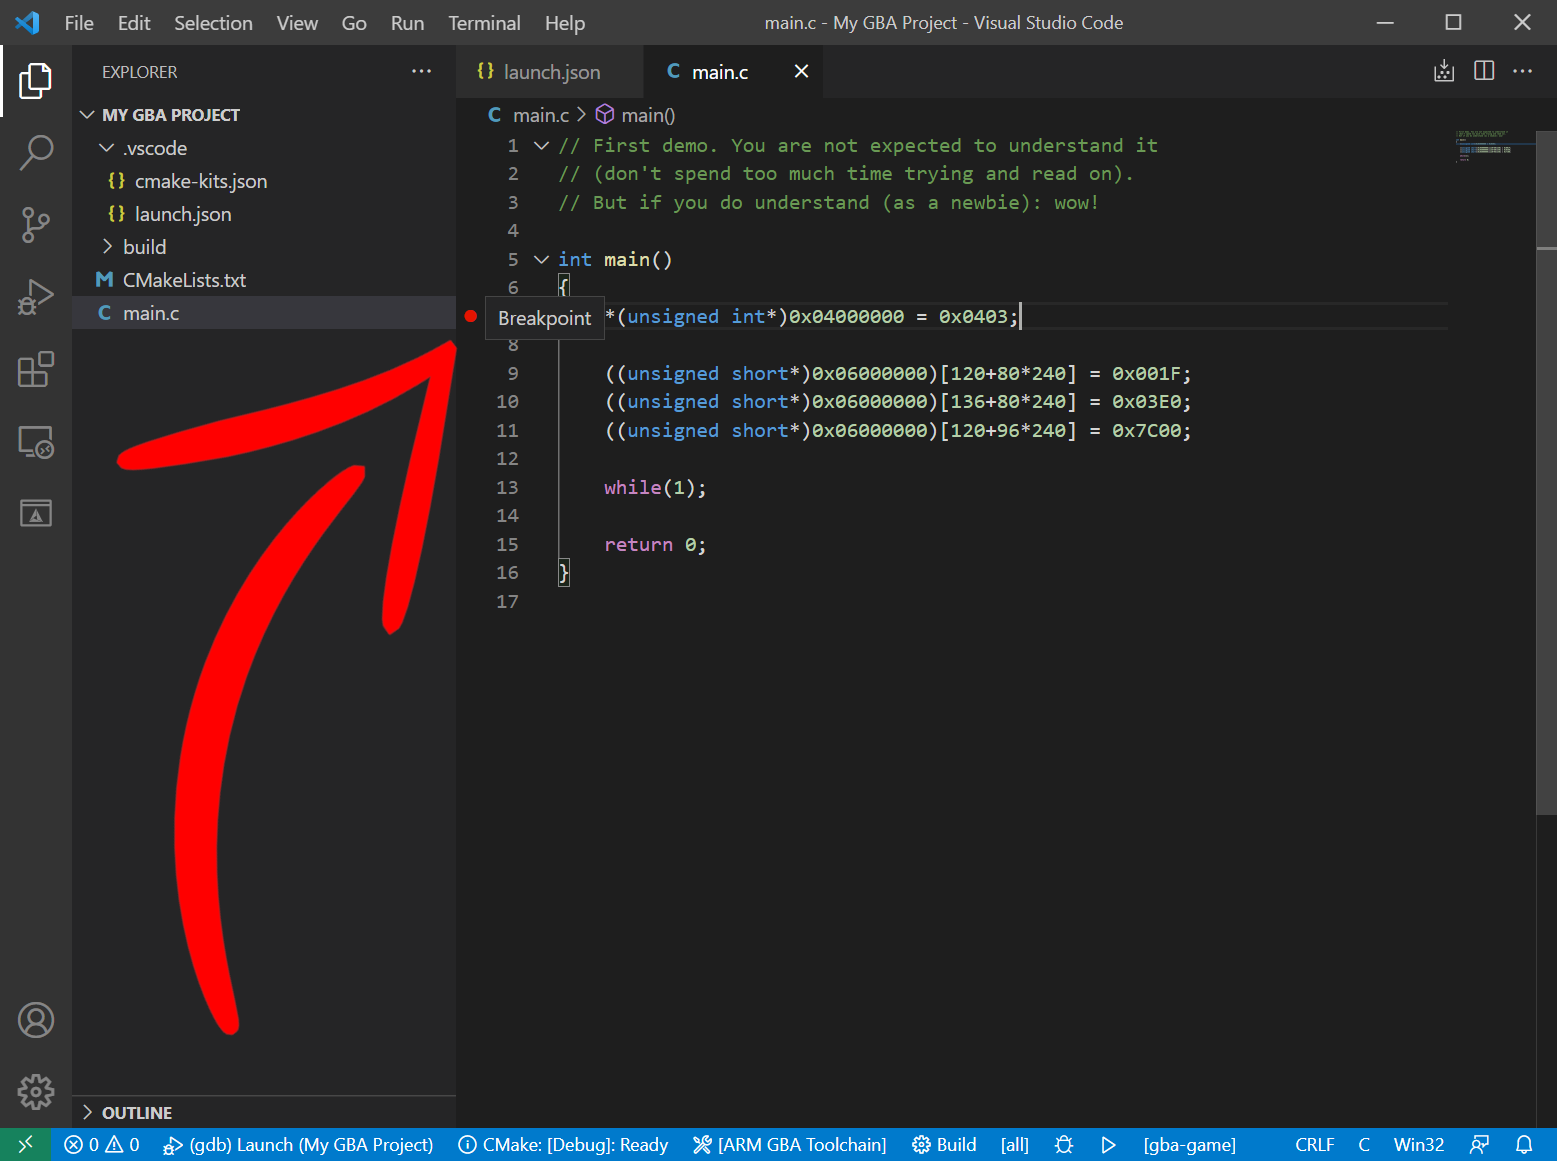
Set a breakpoint
It’s time to debug!
In our main.c, click in the margin to the left of line 7 to set a breakpoint.
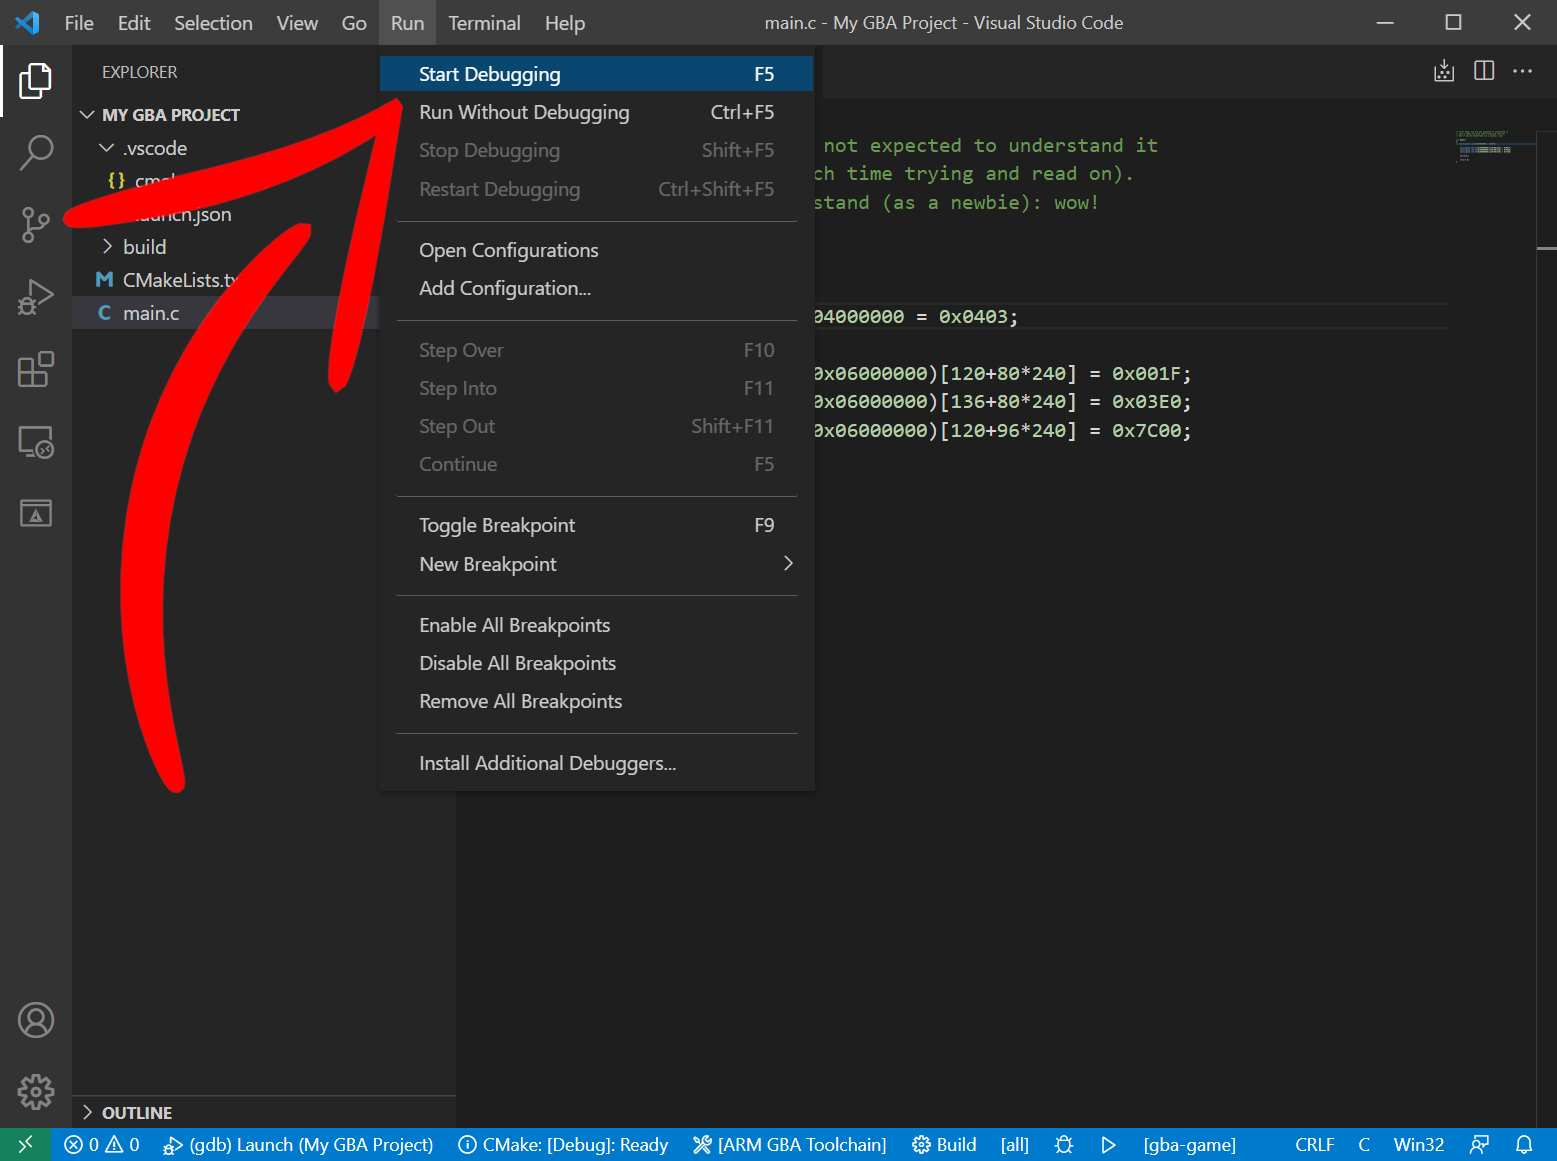
If everything has been set up correctly, we should now be able to use Run -> Start Debugging:
And once mGBA launches, our breakpoint should be hit and VSCode will enter debugging mode:
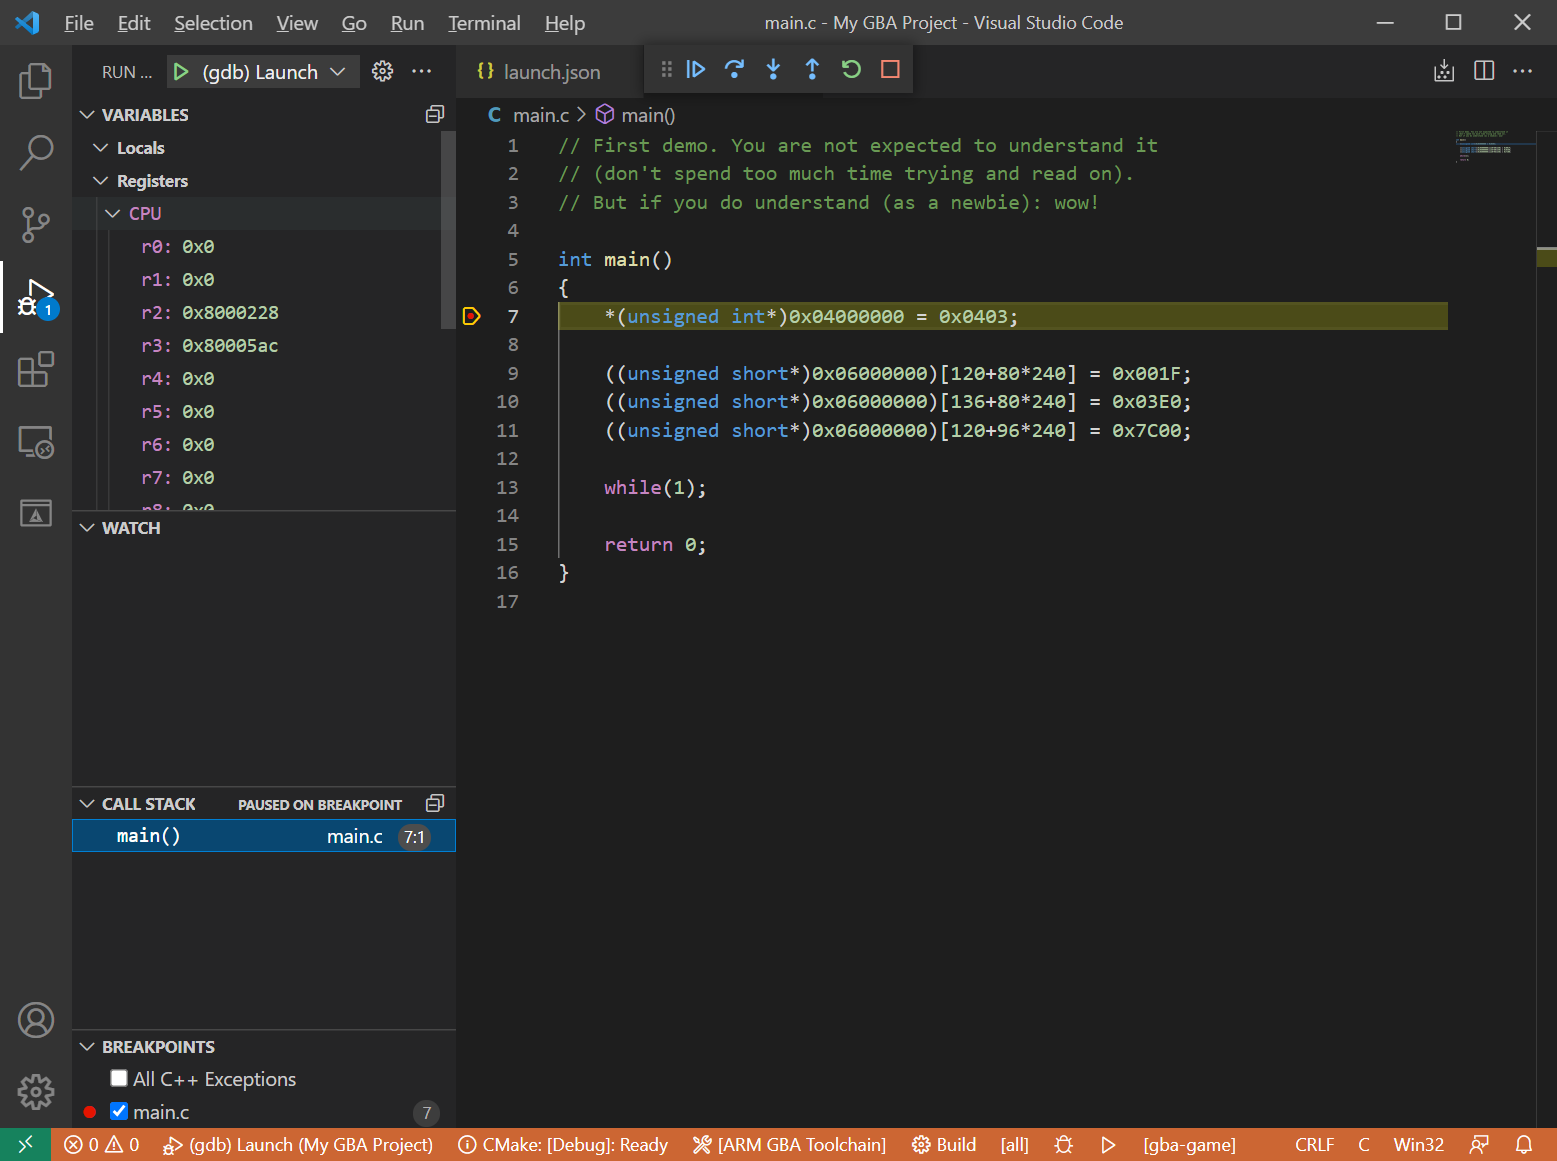
Notice how I expanded the registers view to see the CPU registers.
For information on using the VSCode debugger take a look at: https://code.visualstudio.com/docs/editor/debugging
You can also use the debugging console to send gdb commands:
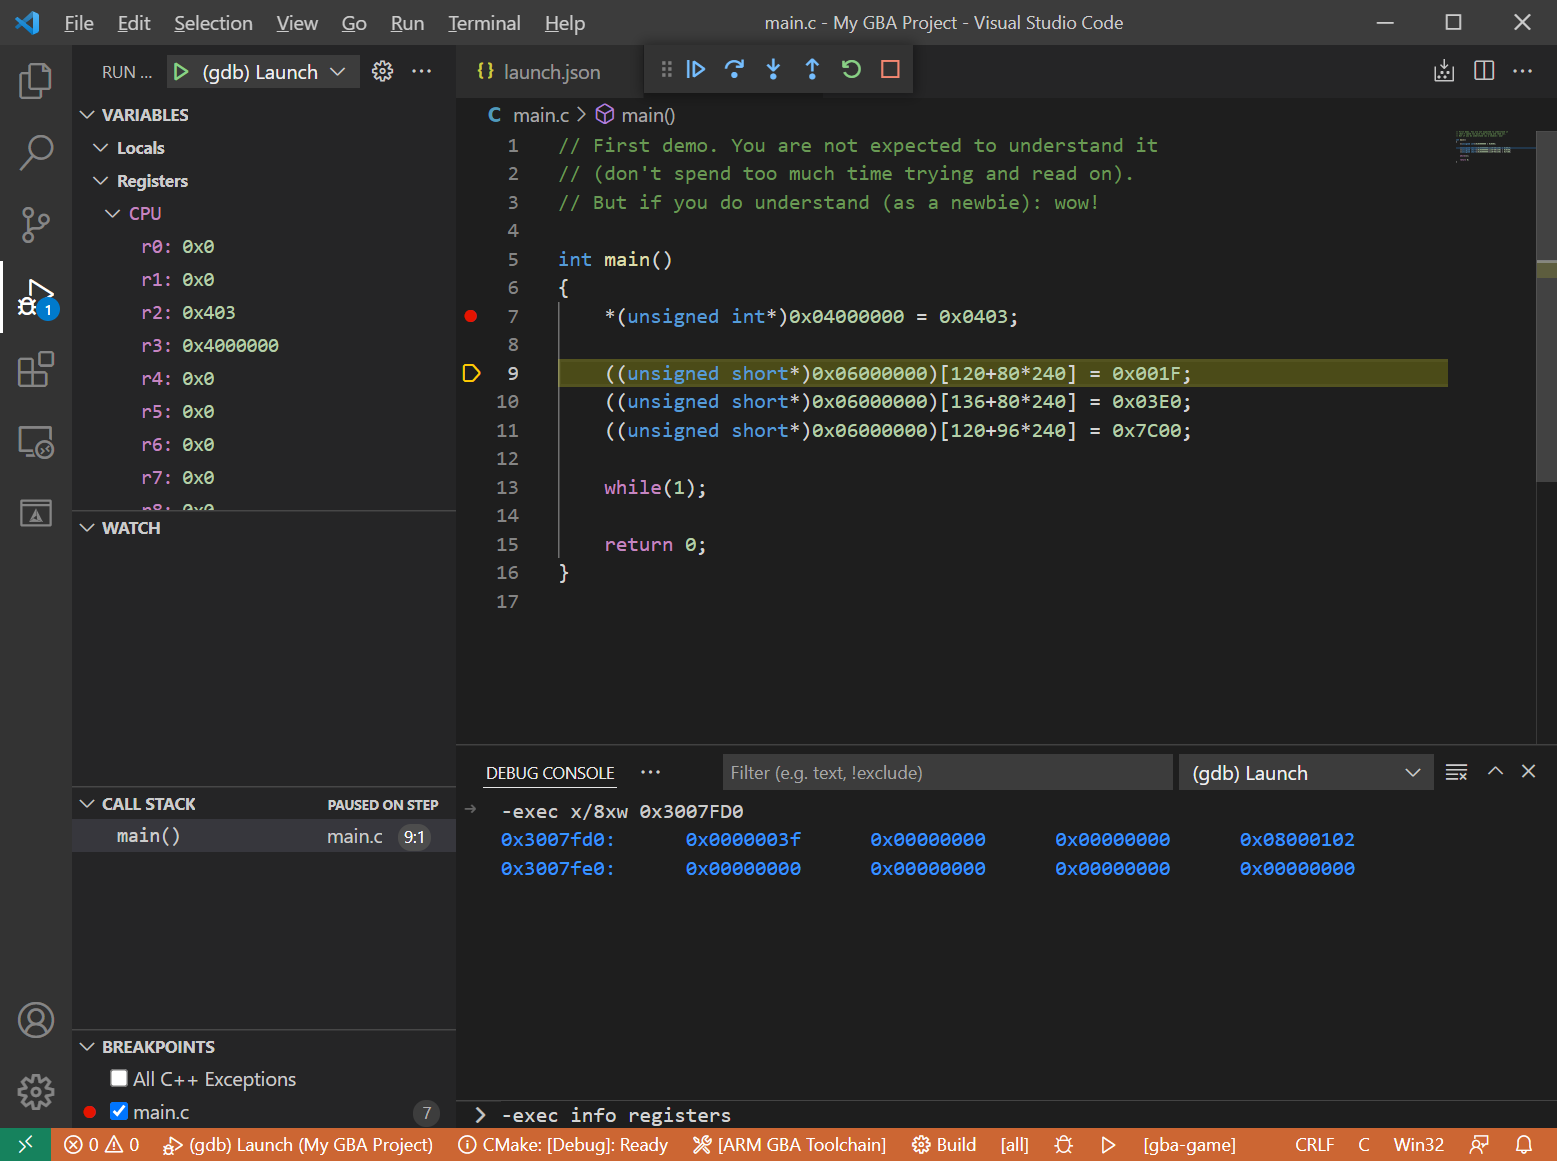
mGBA’s memory viewer, register viewer, etc, are all available also.